
Lee County unemployment fell to 2.9% in August, the lowest August in federal records back to 1990. The labor force also shrank by about 1,050 people.
Lee County’s unemployment rate fell to 2.9% in August. That is down from 3.8% in August 2025 and 3.4% in July, according to the U.S. Bureau of Labor Statistics.
It is the lowest August rate for the county in the bureau’s records, which go back to 1990. The August figure is preliminary and can be revised.
The drop has a second side. The county’s labor force, the people working or looking for work, shrank by about 1,050 over the year. So part of the fall in the rate came from people leaving the labor force, not only from people finding jobs.
The numbers
The bureau’s Local Area Unemployment Statistics for Lee County, not seasonally adjusted:
| August 2025 | August 2026 | Change | |
|---|---|---|---|
| Unemployment rate | 3.8% | 2.9% | down 0.9 points |
| Unemployed | 1,441 | 1,070 | down 371 |
| Employed | 36,854 | 36,175 | down 679 |
| Labor force | 38,295 | 37,245 | down 1,050 |
The 1,070 people counted as unemployed is also the lowest August count since the series began in 1990. The bureau counts someone as unemployed only if they have no job and looked for one in the past four weeks.
It is not the lowest month on record. The county’s rate reached 1.8% in April 2024, the lowest monthly figure in the bureau’s data since at least 1996.
How Lee County compares
Statewide, Mississippi’s unemployment rate was 3.2% in August, down from 4.1% a year earlier, on the same not seasonally adjusted basis. Lee County ran below the state.
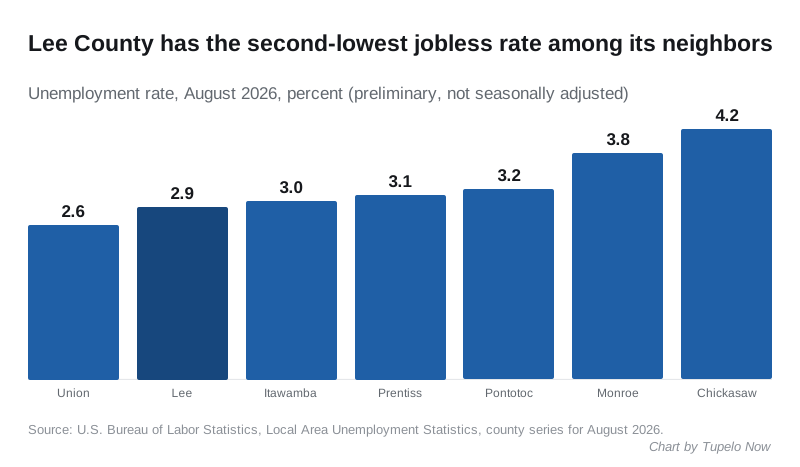
Among Lee and its six neighboring counties, only Union County posted a lower rate:
- Union County: 2.6%
- Lee County: 2.9%
- Itawamba County: 3.0%
- Prentiss County: 3.1%
- Pontotoc County: 3.2%
- Monroe County: 3.8%
- Chickasaw County: 4.2%
Every one of the seven counties had a lower rate than in August 2025, by the bureau’s county figures.
A decade of Augusts
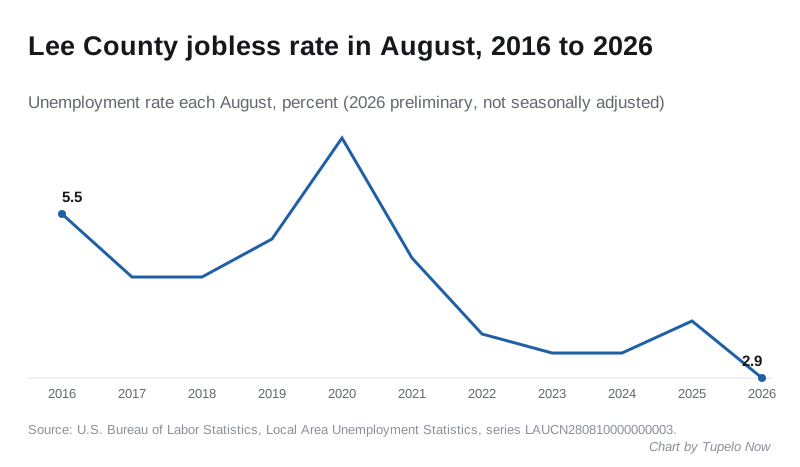
These figures are not seasonally adjusted, so comparing August with August is the fair test. Lee County’s August rate, by year:
| August | Rate |
|---|---|
| 2016 | 5.5% |
| 2017 | 4.5% |
| 2018 | 4.5% |
| 2019 | 5.1% |
| 2020 | 6.7% |
| 2021 | 4.8% |
| 2022 | 3.6% |
| 2023 | 3.3% |
| 2024 | 3.3% |
| 2025 | 3.8% |
| 2026 | 2.9% |
The 2020 figure reflects the pandemic. The highest August in the full series was 10.5%, in 2009.
One gap in the record: the bureau published no county figure for October 2025, because of the 2025 lapse in federal appropriations.
What it means for you
- If you are hiring, the pool of people actively looking for work in Lee County is the smallest it has been in an August since 1990.
- If you are looking for work, fewer people are competing for openings than a year ago.
- If you are watching the economy, the shrinking labor force matters as much as the low rate. A rate can fall when people stop looking, as well as when they find jobs.
The September county figures are due from the bureau in the coming weeks. We will report them when they are published.
Related: Tupelo home prices, moving to Tupelo and new businesses in Tupelo.
Have your say